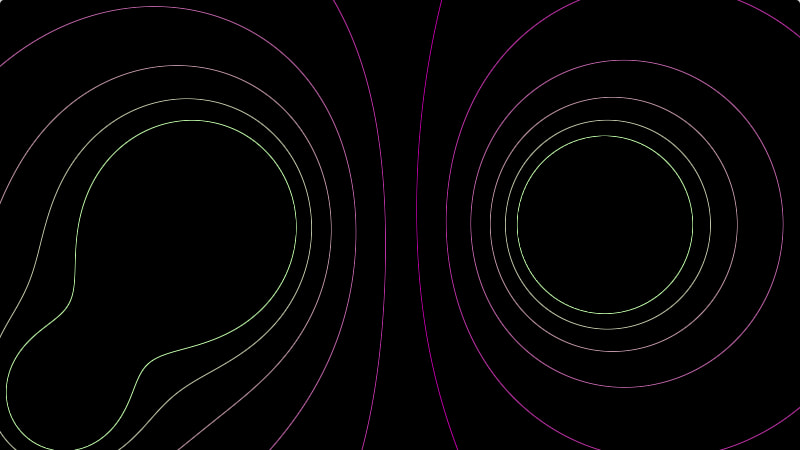
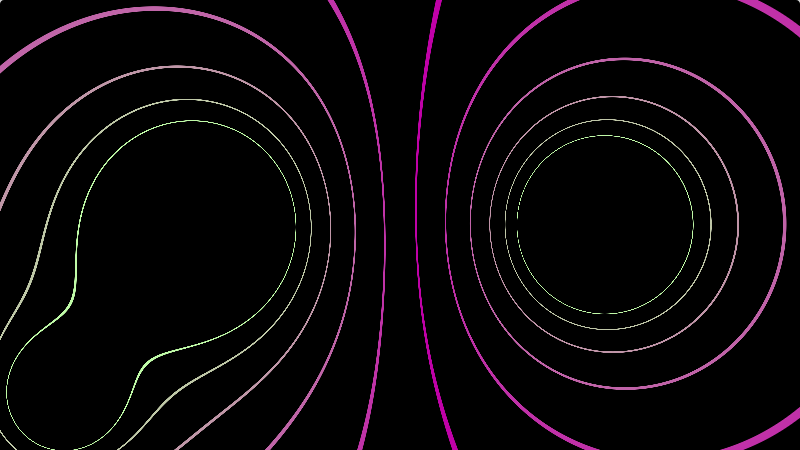
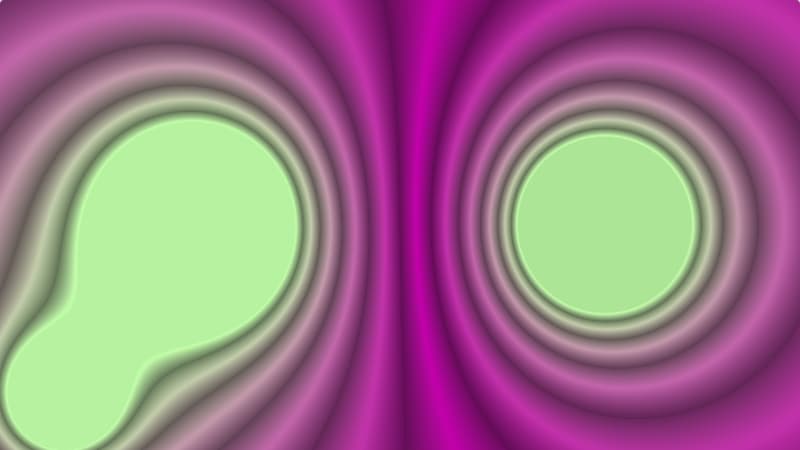
Equipotential Lines Simulation
The animated background on this site isn't pre-rendered! It's a WebGL shader illustrating a real physics concept. It comes with its own controller class and style-able React component. I tried building it with modularity and reusability in mind.
Tools Used: GLSL, WebGL, Typescript, React.
(Okay, technically I used Preact instead of React for this one, as I’m not sure how many readers would know what the former is when they look at the summary above. This should be compatible with React, regardless.)
Table of Contents
- Why I Made This
- What I Came up With
- My Approach and Tools
- The Physics Involved
- Key Fragment Shader Snippets
- Rendering to a Full-screen Quad
- The Preact Component
- Lessons Learned
- Appendix: Designing My Site Around This Thing
Why I Made This
Believe it or not, I had the idea during the electrostatics unit of a physics course I was taking. We were learning about electric fields and how to draw the lines by hand.

Cool! We got to draw a little bit in University Physics, it was fun.
I also learned that lines which are perpendicular to the electric field are called equipotential lines:

Even cooler! The pattern that emerged from this caught my interest. I was fascinated that the equation to calculate this sort of thing was very simple, but to draw it all by hand for every spot on the canvas was quite tedious.
Then, two coinciding thoughts came forth at the time:

I was very curious to see how near-instant updates of these lines would look as you moved them around and adjusted their charge magnitudes.
Since I felt most comfortable writing web interfaces, I explored my options there first.
It would have been too much of a challenge to try this with plain-old HTML and CSS, unfortunately. The idea also seemed like it would very intensive on the CPU to draw sequentially, BUT
That same semester I was also taking a course where I got to learn more about things like Graphics Cards and WebGL and GLSL and things of that nature.
Not long did I realize I could calculate an electric potential for each pixel on the screen at the same time per frame render if I just used the GPU by writing a shader. I was very excited to experiment with this idea once I find the chance to work on it.
I think that semester was a pretty big character-building period for me. The two courses I took during that time fed into each other a lot like bread and butter, and I grew a deeper appreciation for both physics and computer graphics as a result. Having a GPU-rendered physics simulation seemed very fitting to have on a website about me.
There also didn’t seem to be many good-looking and performant simulations for equipotential lines at the time, so I felt it’d be nice to throw my work into the mix, as well. Maybe someone will create a proper virtual physics lab out of it someday.
What I Came up With
I spent a great deal of time figuring out how to make this shader as customizable as possible. I wanted to make it both flexible to future site adjustments, as well as compatible with other projects should someone want to build off of it in the future.
As of writing this, the main features I managed to implement are:
- The ability to define the position and value of up to 8 charges on the canvas at a time.
- Automatic detection of DOM elements with either a
js-charge--posorjs-charge--negclass, rendering corresponding charges at each element’s position. - A callable “transitionTo” function that animates a transition from one shader state to another, with an optional argument for passing down a custom interpolation function.
- Adjustable line thickness, defined by a shader variable.
- Anti-Aliasing (probably the hardest one for me to figure out).
- Responsive updates whenever the viewport is resized.
- Background and foreground colors that are configured with CSS and updated at run-time.
- A pause and resume function for the shader’s animations.
My Approach and Tools
At first, the project sorta began with me tinkering around on Shadertoy to see if I could manage a working prototype. Once I finally figured out how to simulate equipotential lines within Shadertoy, I moved on to figuring out how to render the shader onto a web page of my own.
Since I also wanted this shader to be usable on more than just my own website, I needed to carefully think through on my approach. Thus, I ended up with 3 modular layers:
.")
- The shader itself. More specifically, a fragment shader I wrote in GLSL and polished as much as I could with adjustable constant variables and few uniforms. This alone could be integrated in programs running outside of the web browser, including game engines.
- A Typescript class that uses WebGL libraries to render the shader onto a fullscreen quad within a HTML
<canvas>element. This class serves as an interface to control and configure the shader, and runs independently from any front-end frameworks to allow for portability. - A Preact component that manages state, event listeners, and interacting with the DOM. The code written here computes charge positions for the shader and initiates transitions based on the current state of the web page (both via the typescript interface). Since React is popular, it felt sensible to make this component React-compatible, even though it mainly serves my specific use case. Someone else might able to understand and modify it for their own needs, though.
The Physics Involved
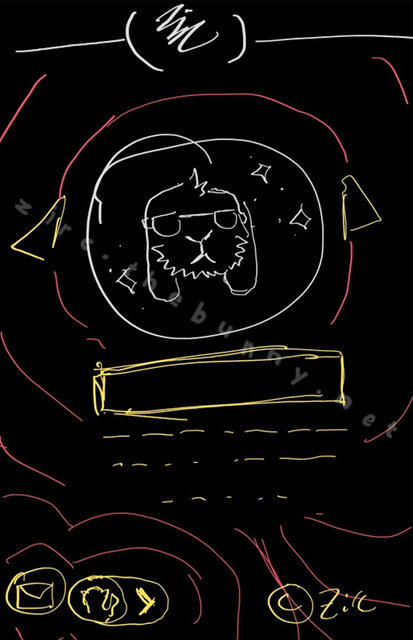
⚠️ NOTE: The next few sections are pretty long and in-depth. If you wish, you may skip ahead to read the lessons I learned and see the polished site wireframes I made. I also talk about accessibility features down there, too. Do enjoy the cute doodle I made below before you go.
If particles were skiers, electric potential would be the hilly slopes that they ski on. The speed and distance that a particle is able to travel is determined by the elevation and steepness of these hills.

Electric potential describes an energy that moves a particle through this space. In essence, it tells us how much work is needed to move electricity up and down these “slopes” from a given position.
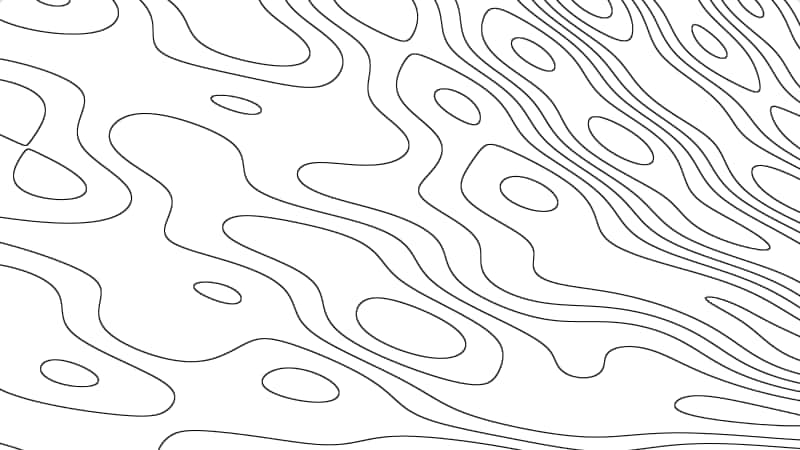
Much like hills and mountains having their own topographic maps to illustrate their elevation, electric potential can be illustrated the same way!

On these electric “topographical” maps, a solid line represents a single uniform “elevation”, or electric potential. Because each line represents a single value of potential that is equal along the whole path of the line, it is called an equipotential line (as in “equal potential”).
Electric potential is measured in “volts”, and often is referred to as the “voltage” of electricity at a given spot. One of the equations used to calculate this is:
")
Where q is the charge (in coulombs), r is the distance from that charge, and k is Coulomb’s constant. I use this equation in the following section to write the shader in GLSL code.
Key Fragment Shader Snippets
There were three important things I wanted the fragment shader to do:
- Compute the simulated electric potential at the current fragment’s coordinates (based on charge data that’s passed into the shader).
- Draw contour line at an adjustable thickness, such that it can compliment the outline width of elements on my site.
- Some form of anti-aliasing to smooth the lines out.
I only had a vague idea of where to get started with this, honestly. I knew that I could calculate the potential at each point, but wasn’t sure how I could determine a fragment’s color from just that information alone…
…until I found this magnificent example written by 8x on Shadertoy that I chose to use as a jumping-off point. There were a few other existing contour line shaders on there, but this one in particular I found lightweight and understandable enough for me to work with.
Computing the Potential of Each Fragment
#define K 8.987551788

/** Calculates electric potential at a point */
float potential(float q, float r) {
    return K * (q / r);
}
Point charges are passed into the shader as a uniform array of 3D vectors that store the x-position, y-position, and charge (q) values.
For the lines to not go on forever towards the center of each charge, I chose to clamp the electric potentials between a min and max value that seemed reasonable (I call this the “height cutoff” in my code).
Line Thickness
As the name for “equipotential” implies, lines are drawn at spots with equal potential. In this case, the shader draws lines where the electric potential is a whole-number value. Doing that alone would likely leave us with lines that are only about a pixel wide.
For thicker lines, I have them drawn at a range of values where the center is a whole number (e.g. between 1.95v and 2.05v).
Since I am using electric potential / voltage values to determine where lines are drawn at a given thickness, the line will be thicker in areas where electric potential doesn’t change much (the slope is smaller), and thinner in areas with high rates of change (the slope is larger and steeper).
Anti-Aliasing (Line Smoothing)
This one was probably the hardest part for me to wrap my head around. My solution might not be perfect, but I’m proud with how well it turned out in the end. I originally found this article hoping it would help, but ultimately didn’t get very far. I decided to leave the shader aliased and set aside for a while.
Fast forward a month or two later, I gave it another go. This time, I dug into the comment thread of that contour lines shader for ideas, and did a bit of tinkering around with the code to figure out what exactly was going on as best I can. Eventually, this is what I ended up with:
Click here to reveal the full breakdown.
In a nutshell, I tried to look at the problem as simply drawing gradients from a median. The further away from a line, the more the line color fades out. This would be easy if the lines were 1-pixel thick, but they aren’t.
First, we gotta figure out how far away we are from the nearest “edge” (a.k.a. nearest whole number ± half the line thickness). Since the distance is determined by the nearest whole number, we could grab the fractional part of our value and subtract the half-line thickness from it. Lucky for us, there is a built-in function for grabbing the fractional part of a number:
fract(2.87); // returns 0.87Here is how I use it:
float d = fract(z+0.1) - radius;Where ‘z’ is the electric potential at a given point, and ‘radius’ is half of the configured line thickness.
For values that are too far away from the charge’s center, the electric potential approaches zero (a whole number), those pixels will be colored red (or whatever was picked as the line color). I wanted the background color instead, so I added the line thickness (which I had configured to be 0.1) to force the minimum value into something that is “outside” of the line.
(I should also note that I omit the +0.1 in the Shadertoy demo because it resulted in the negative charge’s center to be filled in, so I’m not completely certain this is the most effective solution to that issue).
Anyways, so far we’ve determined the distance away from the nearest line edge as the variable d, kinda.
If the fractional part of a number is greater than 0.5, then that value is actually closer to the whole number above it rather than below, so far the code only assumed that the nearest whole number was always less than or equal to the current value.
SO, quick fix right here, just subtract d from 1 (and then some):
if(d > 0.5) d = 1. - d - radius;Now we make sure to clamp d between 0 and 1 since it will be used to figure out how much we want to fade the line color out by:
d = clamp(d, 0., 1.);If we were to skip down and draw our lines now, the code so far would draw gradients spanning the entire distance between each line.
They’ll need to be shortened a little if we want a convincing anti-aliasing effect.
Here’s how I do it, this goes right before the clamping function above:
d = d/(fwidth(z)+radius)/BLUR_AMOUNT;From my understanding, fwidth could be understood as a partial derivative at that point, where the GPU compares the value for z against values computed for z at neighboring fragments, returning the rate of change in that area.
This means that “steeper” areas with higher rates of change will result in a thinner gradient than areas that are less steep. I also include the half-line width again in the above snippet, as well as a constant “blur amount” variable that can be adjusted for one’s needs. I feel like I probably could’ve worked with a more efficient computation (without fwidth) than what I settled with here, but I have yet to look into it.
The chunk of code covered in this section so far looks like this:
float d = fract(z+0.1) - radius; // distance from the edge (line's middle is where z is a whole number)
if(d > 0.5) d = 1. - d - radius; // assures that it's distance from the /nearest/ edge
d = d/(fwidth(z)+radius)/BLUR_AMOUNT; // dampens the length of the gradient

// Clamp the value of 'd' between 0 and 1
d = clamp(d, 0., 1.);
Finally, the value for d can be used to determine how much we interpolate between the foreground (line) and background color for that fragment:
fragColor = mix(fg, bg, vec4(d)); 
Rendering to a Full-screen Quad
Something I didn’t quite expect when working directly with WebGL (without any other libraries like Three.js, for example) was the amount of setup required to render shaders the same way they would on Shadertoy.
Good thing there exists a really helpful tutorial on compiling shader programs and rendering them to a full-screen quad polygon.
Using that guide, I was able to write a whole Typescript class dedicated towards handling all that boilerplate (along with a few outside utility functions). I then extended that class to begin work on a controller for my shader.
That controller class has the following features:
- Functions for modifying charge data (coordinates and coulombs).
- A function called
transitionTothat initiates animations from one state of the charge data to another, with an optional argument for passing in a custom interpolation function. - Pause and Resume functions for the transitions.
- Functions for updating the colors used within the shader.
The Preact Component
This one makes the shader reactive to DOM changes. Event listeners are created here, media queries are checked, and elements representing “electric charges” are tracked and interpreted for the shader.
The way that last bit works is that the component looks for custom-defined class selectors using document.querySelectorAll() to determine where charges should be placed onto the shader. js-charge--pos for positive charges, and js-charge--neg for negative charges.
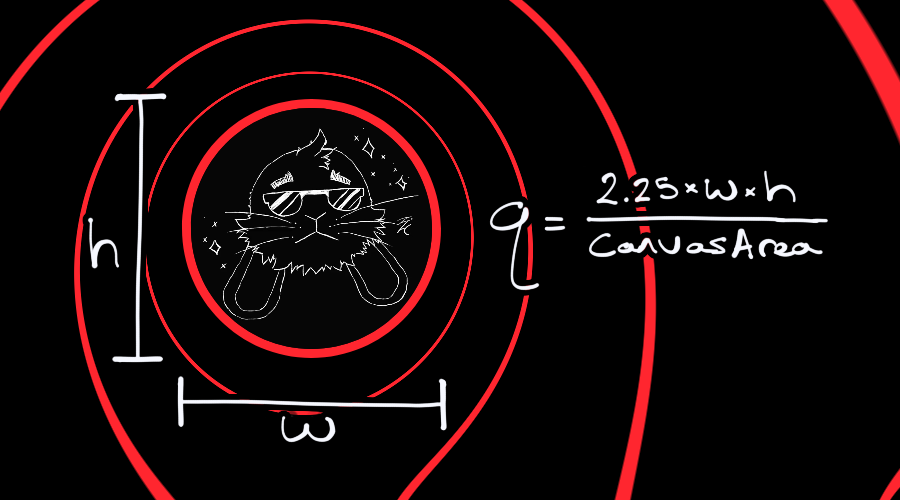
The magnitude of charges are determined by the area of the element’s bounding rectangle (width times height times a fine-tuned scale factor, 2.25 in this case). A larger element size means a larger charge magnitude.
This component would also listen for resize events, and recalculate everything whenever that happens. If there is a transition playing, the transition would need to be seamlessly restarted from it’s current state to it’s updated end-state.
Lessons Learned
Some challenges I would highlight from this project that I learned from are:
- The whole lot of boilerplate involved in creating and rendering a shader program to the canvas, thankfully there are nicely documented instructions on it.
- Now that it’s written, I can save myself some time in the future by re-using that same boilerplate to render other shader programs.
- How to sort of “black box” the shader in a way that can be easily modified like other DOM elements, such as:
- Watching for (CSS and inline) style changes and updating color variables in response.
- Finding the position and size of elements that have a
js-chargeclass and translating that to usable information for the shader to render.
- Early iterations of the shader didn’t take too kindly to the user resizing the viewport / window.
- I had to figure out how to refresh the shader on resize. Sometimes the shader might be animating something when a resize happens, and I needed to account for that.
- How to anti-alias the equipotential lines. I had to set the problem aside for a bit before I figured a distance-based solution out of the very few resources I could find online.
- Addressing potential accessibility problems. I think this is a really cool effect, but I worry some might find it nauseating to look at. I figured it would be best to include ways to disable the effect for those who might be sensitive to it. I wrote more about this in the appendix section below.
Since taking on this project, I’ve grown more comfortable working with WebGL rendering contexts and writing code that directly interacts with the DOM. Some of the things I learned will help me be a little less reliant on outside libraries and frameworks in situations where they aren’t necessary or lacking in functionality.
Appendix: Designing My Site Around This Thing
Drafting in Figma
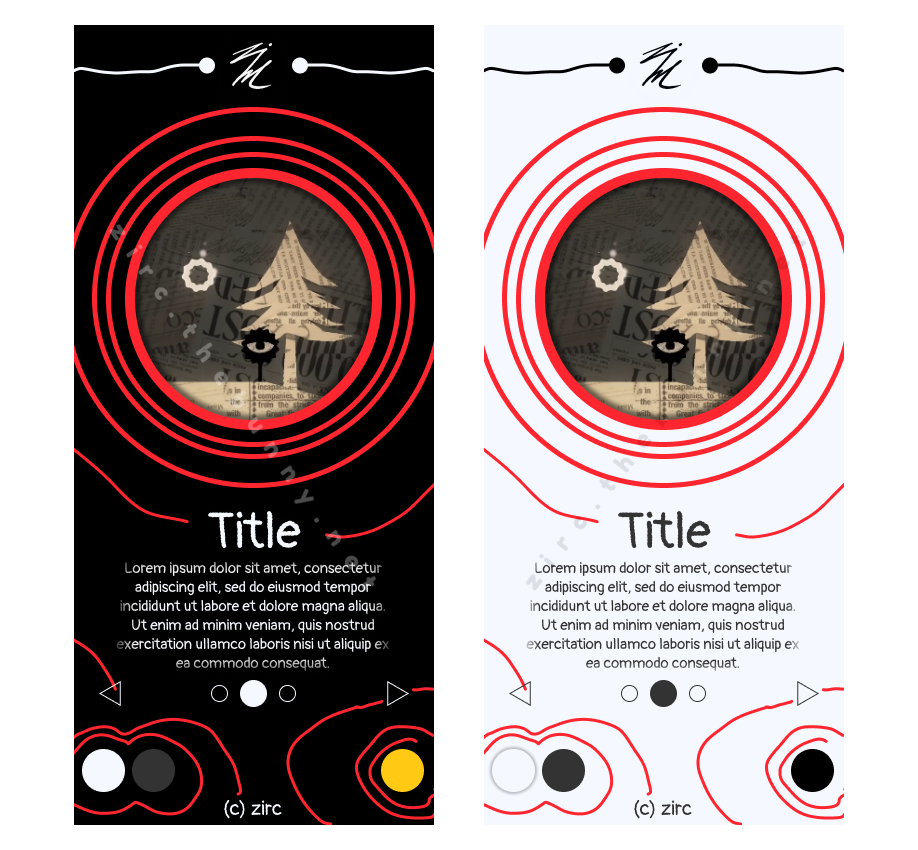
I went with a mobile-first design at first, and adapted it to landscape screens.
What seemed to work pretty well is having matching outlines for various elements that the equipotential lines could blend into.
I also made plenty use of circles, since that’s the shape that electric charges are often depicted as in such diagrams.
Accessibility Concerns
Reduced Motion
A big glaring concern about having this shader play as the background to my website is that it MOVES.
It doesn’t really bother me or anyone I’ve shown it to, but I understand that it could be nauseating for others, maybe even disorienting (despite how slow and minimal I tried to keep it).
I even felt tempted to include a charge underneath the mouse cursor’s location that would follow around as you navigated the page—as a way to prove it wasn’t just some pre-rendered video trick—but decided against it for the aforementioned reason.
The prefers-reduced-motion media query was a fairly new thing I learned at the time, but only in the context of CSS. Turns out, it’s not that hard to check for it in JavaScript:
const motionQuery = window.matchMedia('(prefers-reduced-motion: reduce)');
if (motionQuery && motionQuery.matches) {
	delay = 0;
	transitionLength = 0;
}
This was a very quick and painless addition to the Preact component, and I was very eager to add it. If a visitor has a prefers-reduced-motion setting enabled, the lines will immediately appear as if they were a static image.
Toggles
Banking on the user having the media query set is not enough, though. Maybe the lines are just hard to look at even when they aren’t moving? Perhaps it lags someone’s older device?
So I also added a toggle button.
This button does two things:
- Pause any active animations on the shader, and
- Hide the canvas element entirely.
The state of the button is saved to localStorage, so the preferred setting persists for subsequent visits to the site.
Contrast With Text
There are three different solutions I went with to make sure text (as well as other elements) placed over the equipotential lines were still readable:
- Applying a stroke that matches the background color.
- Heavy drop shadows that darkened (or lightened, if on light mode) the area around text.
- Adding a solid background to the containing element and giving it an outline / border that blended with the shader.
Each of these obscure the background in different ways and amounts. I tried applying each of these where they seemed to work best. For example, I went with options that kept the clutter minimal above the fold, but opted for obscuring more of the background underneath it (where there is both significantly more text and lines).